Final remarks - not a fixed solution
After P. Stam, Study Guide of the Wageningen University MSc course Modern statistics for the life sciences.
The outcome of a mapping experiment depends on the composition and size of the sample population. The larger the mapping population, the more confidence we have in the estimates of recombination frequencies and map distances. For most purposes populations of size in the range 80-400 are used. Of course the quality of the marker scores is a major issue as well.
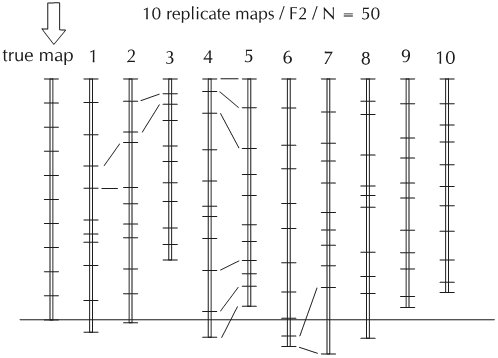
A map that is based on a mapping population of 100 RILs will result in a (slightly) different map than a map calculated on 100 different RILs derived from the same cross. Just because of the fact that every population is the result of sampling gametes, a non-deterministic procedure, recombinations may occur more frequently in one set of 100 individuals than in another set of 100 individuals. The figure below shows the simulated result of replicate sampling of an F2 population and the best map corresponding to each sample. Although the variation between these maps with respect to marker order is nil, the resulting total map length as well as the inter-marker distances are quite variable. This demonstrates that the 'ultimate true map' does not exist. A calculated map is the best statistical approximation, given the sample population.
|
|
Graphical representation of ten linkage maps, derived from one true map by simulation (not treated in detail). For each of these maps, a data set was generated by stochastic simulation. The true map (length 100 cM) on the left corresponds to the recombination rates between adjacent markers used in the simulation. For each of these maps, different data sets were generated, using the recombination rates. Due to the variation in the sample composition, the resulting maps are different. Notice that for a given marker pair the estimated map distance may vary considerably (see lines connecting marker pairs between maps). If, in addition to sampling variation, there would also be errors and missing values, in the population for some markers, the differences between the maps will be larger and there might also be reversal of marker orders between different 'replicate maps'. |
A linkage map based on another population will yield a map with larger differences: also the apparent order of some markers may have changed. This will be explained later.
Summary
→ The linkage map may vary depending on the composition of the sample population.