Genetic mapping functions
After P. Stam, Modern statistics for the life sciences
Double recombination events
The recombination frequency between two genes/markers is indicated with 'r' (see picture below): 0 < r < 0.5 (diploids). As we have seen before (Linkage, recombinations and map distance), the recombination frequency over the interval A – C (rAC) is less than the sum of rAB and rBC. Thus rAC < rAB + rBC. This is because (rare) double recombination events (a recombination in both A - B and B - C) do not contribute to recombination between A and C. In fact, any even number of recombination events would go unnoticed, whereas any odd number of recombination events could be observed in the progeny.
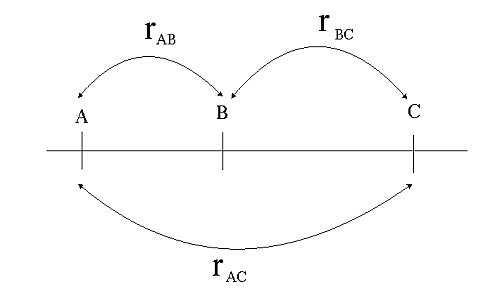
Non-additivity of recombination frequencies: rAC < rAB + rBC.
Double recombinants, i.e. gametes resulting from a recombination event in both the intervals A –B and B – C do not contribute to recombination over the interval A – C.
Theoretically, the most direct way to detect linkage would be to observe the genotypes, and their frequencies, of gametes produced by a parent that is heterozygous at two linked loci (figure below, in which P= parental type of gamete, and R = non-parental, recombinant type of gamete).
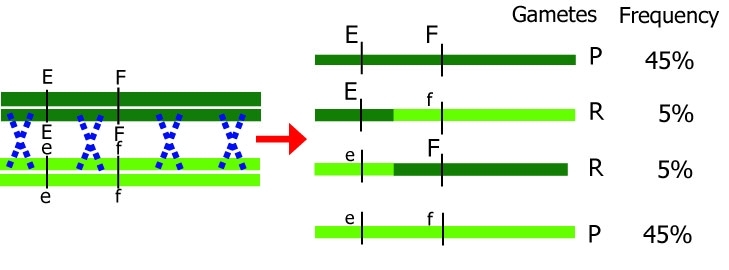
Unfortunately, in most plant species, it is not possible to directly assess the genotypes of gametes (an exception are doubled haploids, which reflect the gametic constitution, or testcross/backcross situations). Therefore, we often have to resort to indirect ways of observation, which means not observing individual gametes but the result of fused gametes, i.e. the offspring of two parents. In practice, linkage of loci is derived from the observation that among the offspring, alleles are associated ('go together more often than expected by chance') rather than segregating independently. With co-dominant markers, like SNPs, such an analysis is sometimes, but not always, straightforward, since recombinant and non-recombinant genotype classes can be distinguished. With dominant markers, gamete genotypes and their frequencies can still be determined unambiguously in terms of being caused by recombinant or non-recombinant gametes in a DH, testcross or backcross:
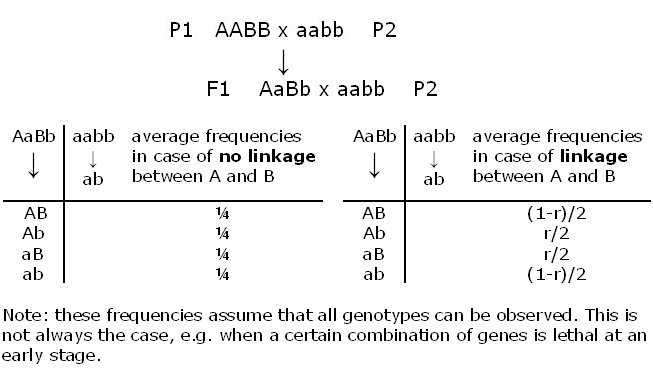
The backcross described above is the most simple in this respect, since the frequencies of recombinant and non-recombinant gametes can be obtained by simply counting the numbers of individuals in the recombinant and non-recombinant genotype classes. In many other cases, there is not such a one-to-one relation between marker genotype class and the origin (non-recombinant or recombinant) of the gametes that gave rise to this phenotype. For example, even for codominant markers, in an F2, the double heterozygous class AaBb is ambiguous: individuals in this class could be from two non-recombinant gametes (AB with ab) or from two recombinant gametes (Ab with aB), so that this class cannot be counted as entirely doubly recombinant or non-recombinant. The situation of not being able to count the recombinant and non-recombinant gametes exactly often also arises for dominant markers, or simply because of missing scores for one or both markers.
Assume the observed recombination frequencies in the picture below:
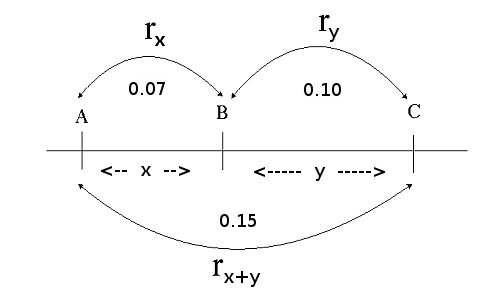
Ordering genes on the basis of observed recombination frequencies. The order A – B – C is readily inferred. When many loci are to be assembled into a linkage map, ordering requires 'smart' computerization, since the number of
possible orders increases approximately exponentially with the number of loci.
The distance 'x' between markers A and B is estimated by recombination frequency rx (and y by ry). The closer A and B are together, the smaller the expected recombination frequency between A and B: rx. Note that the recombination frequency between A and C (rx+y= 0.15) is smaller than the sum of rx (0.07) and ry (0.10) due to double recombinations between A and C. In fact, any even number of recombination events would go unnoticed, whereas any odd number of recombination events could be observed in the progeny.
Assuming no interference
In the absence of interference, recombination events in adjacent intervals (and as a result, in any pair of intervals) are independent. Under the assumption of no interference:
rx+y = rx(1 - ry) + (1 - rx)ry = rx + ry - 2rxry
(where:
rx = the recombination frequency between loci A and B
ry = the recombination frequency between loci B and C
rx+y=the recombination frequency between loci A and C)
In the example the expected recombination frequency between A and C, as estimated from AB and BC, would then be 0.07 + 0.10 - 2*0.07*0.10 = 0.17 - 0.014 = 0.156, close to the 0.15 that was observed from the genotype counts for the A and C locus directly.
Assuming positive interference
A consequence of positive interference (smaller chance on cross-overs in the neighborhood of an existing cross-over) is:
rx+ y > rx + ry - 2rxry.
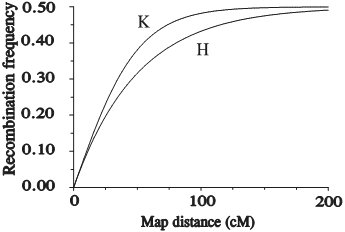
Genetic mapping functions
A genetic mapping function describes the mathematical relation between recombination frequency (r) and map distance (x). The map distance between two loci is the average number of recombination events per meiosis between those loci. The exact relation between r and x depends on the degree of interference between recombination events, in adjacent intervals.
|
|
Extra information (for illustration only): The most widely used mapping functions, Haldane's (H) and Kosambi's (K) mapping functions Haldane's mapping function (derivation not shown here) uses the assumption of no interference and reads: r = ½ (1-e-2x). Kosambi's mapping function is a mapping function that (empirically) appears to be fairly well describing the strength of interference in many organisms. It reads: r = ½ tanh(2x). This results in (derivation not shown here):
Note that Kosambi's leads to a shorter map distance for a given recombination frequency. In addition to these two mapping functions a whole family of genetic mapping functions has been designed, each corresponding to a given degree of interference (after Stam, Study guide from the Wageningen University MSc course Modern statistics for the life sciences). Note also that Haldane and Kosambi are non-linear functions.
|

Summary
→ Recombination frequencies are non-additive. Map distances (in cM units) are
→ Recombination can be reduced or enhanced by recombination events in adjacent intervals: interference
→ Mapping functions describe the mathematical relation between recombination frequency and map distance
→ Haldane's mapping function uses the assumption of no interference; Kosambi's mapping function allows for positive crossover interference. Many other mapping functions exist. They do not result in big differences, especially not for small distances.