High-resolution mapping of specific chromosomal regions
There are two possibilities to obtain a higher resolution (a higher density of markers) of a particular chromosome region of interest:
- Through bulked segregant analysis (BSA)
- Through development of near-isogenic lines (NILs)
Bulked-segregant analysis
 A bulked-segregant analysis (BSA) approach can be applied to target specific chromosomal regions (between target marker loci V and W). We have seen BSA in the previous chapter, where it was used to identify markers linked to genes, by means of grouping individuals of the phenotype classes corresponding to the genotypes for the gene of interest. In this case, however, phenotypic groups are not needed, since we are trying to find markers linked to other markers, not to a gene for a phenotypic trait:
If a gene for a trait of interest was calculated to be located between marker loci V and W in a mapping study, in the BSA approach DNA is pooled from VW plants and from vw plants. The DNA from these two pools, is tested for many markers. A marker that has one specific allele in the VW pool and another allele in the vw pool, thus co-segregates, must be located very closely to marker loci V and W.
To find out whether these newly found markers are located more closely to the gene of interest than V and W, individual members of the mapping population will be genotyped with those new markers, and the position of those markers (likely near V and W) will be determined. Next, the association of those markers with the trait value will be determined to see which will appear to be the peak marker.
Near-isogenic lines
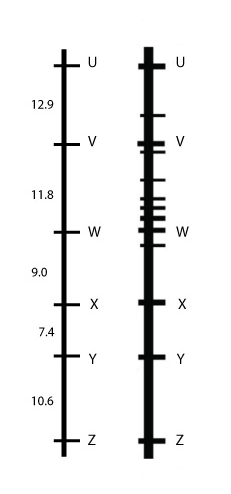
Also near-isogenic lines (NILs) can be used to construct high-resolution maps for specific chromosomal regions (see figure below), because NILs differ from each other only with respect to small portions of the genome. Once a QTL has been identified and its approximate position is known from mapping studies, NILs can be created that contain only a single QTL by repeated backcrossing with the recurrent parent. During this process, there may or may not be active selection against donor parent marker alleles in the background (marker-assisted backcrossing – speeds up the selection process). High-resolution mapping can sometimes also reveal the presence two closely-linked genes, which are seen as one QTL in a small mapping population. One of the difficulties in precisely locating a QTL on a linkage map for a quantitative trait is that other QTLs influence the trait as well and therefore the error in the estimated map position of a given QTL can be quite large. By creating NILs that (preferably) each only have a single segregating QTL this effect is reduced and therefore the map position can be established more accurately.
In this example, a near-isogenic line (NIL) contains a gene of interest which is situated between markers M1 and M2.
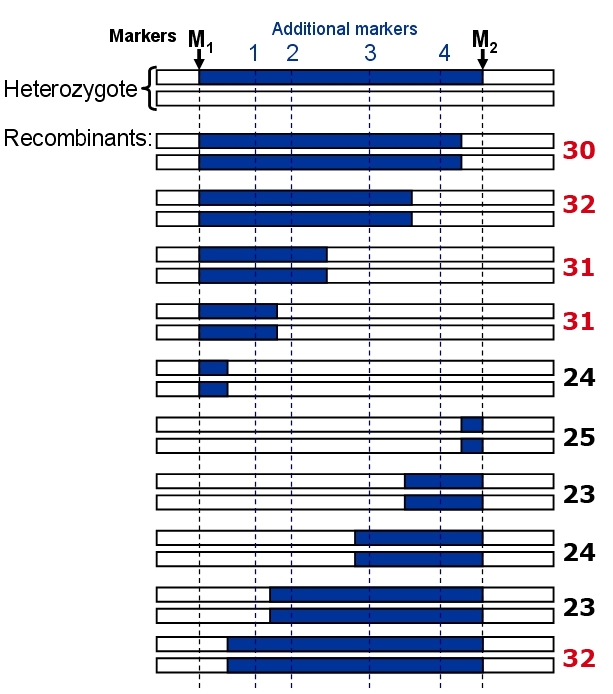
Example of fine mapping of a QTL, starting from a heterozygous Near-isogenic line containing only one segregating QTL. The blue chromosome segments represent the DNA of the + allele donor of the trait. Logical analysis shows that the contributing gene should be to the left of additional marker 2, since the fourth recombinant has still the high trait value. The low trait value of the ninth recombinant (23) also suggests that the gene should be to the left of marker 2. In this example, the gene could also be left of marker 1, so we conclude that the gene is located between M1 and marker 2. Note that we should test preferably more than one recombinant per marker interval and phenotype several replicates for every recombinant genotype if possible, to reduce environmental effects on the mean trait value of each recombinant.
Suppose that the gene of interest is located in between marker 1 and marker 2, recombinants between marker 1 and 2 may either have the higher or the lower trait value, depending on the precise location of the gene and the precise location of the recombination event. If the marker 1 – marker 2 interval is largely blue, and the gene is half-way, the trait value will be high, if it is largely white, the trait value will be low. Finding both trait value classes in the same recombinant group is evidence that the gene is in that particular marker interval.
Next, the NIL and recurrent parent are crossed to develop an F2 between them (it may also be the last backcross towards a near-isogenic line). In the F2 recombinants between M1 and M2 may be identified. Running the additional markers between them (1, 2, 3, and 4) will tell where the recombination occurred approximately. The recombinants contain different parts of the original donor fragment and can all be recognized by recombination between M1 and M2. In the figure, 10 different progeny lines are shown and 4 additional markers between M1 and M2 are needed to distinguish them. Phenotyping of the plant will show in which interval (M1 - 1, 1 - 2, etc.) the donor allele of the gene of interest is located. When a QTL is situated between M1 and M2 it can be mapped more accurately (assigned to a smaller region) using markers 1 – 4.
Note that the length and end points of each fragment cannot be known exactly from the additional markers. In figures, the fragment ends are always drawn in the middle between two markers but it may in fact be anywhere in the interval.
The homozygous NIL and the recurrent parent are identical, except for the region a little beyond the interval between M1 and M2.
Show/hide comprehension question...
DNA of the NIL and the recurrent parent can be submitted to a search for polymorphism, for example by SNP array. All polymorphism identified should in principle correspond to marker polymorphism in the region of interest. By this way, the area between M1 and M2 may be filled with more markers.
Show/hide comprehension question...
Show/hide comprehension question...
Show/hide comprehension question...
Summary
→ High-resolution mapping of specific chromosomal segments can be performed by using BSA or NILs. BSA is aimed at filling an already identified marker interval with more markers, whereas NILs are used for the actual fine-mapping, improving the estimate of the position of the gene, improving the resolution.
Show/hide comprehension question...
I want to try extra questions | Move on to: Marker validation