High-resolution mapping II
Sometimes, a group of markers always segregates together in a mapping population. In that case, their order on the map is not clear. When a larger mapping population is used, some recombinations among those markers may occur, and their relative positions on the map may become clear. Such a further resolution will not be possible if the DNA stretch is not or insufficiently homologous to the DNA of the other parent (see chapter on Linkage mapping, paragraph on "Other reasons for large gaps in genetical maps: non-polymorphic DNA regions".
|
|
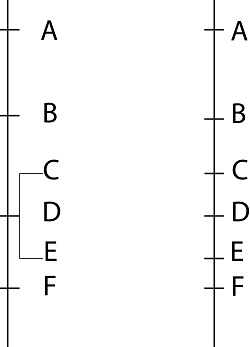
Co-segregating polymorphic markers C, D and E (left), may segregate and be mapped on the chromosome when a larger mapping population is used (right). |
Relevance of population size for high-resolution mapping
To estimate the location of a gene or QTL on the genomic map very precisely, large mapping populations are needed. The QTL is discovered on the basis of the phenotyping of the mapping population for the trait of interest. That trait is measured under a certain experimental error, and there is only a very limited probability of recombination across the chromosome, so that many linked positions have almost the same association to the trait. In addition, other unlinked or linked QTLs may also influence the trait. This results in generally large support intervals for QTLs. No general minimum number of individuals for a population size can be given to perform high-resolution mapping, but in a larger population, the probability of finding recombinants is higher than in a small population and the distance between marker and gene can be estimated with more accuracy. In order to find a marker within 1 cM of a desirable gene or another marker locus, population sizes of more than 1000 individuals have been used. 1 cM of map distance corresponds to 1% of recombinants, so theoretically 10 recombinants in a population of 1000 individuals. A large population (for example n=1000 RILs) will imply phenotypic comparison of about 500 RILs with the AA alleles of the gene, and 500 RILs with the contrasting aa alleles, which should give a better estimation of the phenotypic contrast caused by the two alleles than in the case of 100 RILs. However, phenotyping 1000 RILs is not always technically or economically feasible. The breeder has to compromise here.
Normally, fine mapping a gene of interest is done on the basis of screening of progeny of a plant that is heterozygous for the QTL region, but rather homozygous for the rest of the genome. A suitable plant is the last backcross before reaching the homozygous NIL-status. The 1000-s of individuals and their progeny are only genotyped for markers in the QTL region.
Show/hide comprehension question...
Techniques
Mapping additional markers may saturate linkage maps in the region where also genes of interest are located. Techniques that produce many markers per reaction, such as DaRT or SNP platforms, are usually preferred to increase marker density (see chapter on markers). In the following pages, several other techniques are described for high-resolution mapping.
Summary
→ High-resolution mapping is often needed to find markers that are more closely linked (< 1 - 5 cM) to the gene of interest than the markers that were initially identified near the mapped gene.
→ Large segregating populations are needed for high-resolution mapping