MAS in breeding
Marker-assisted selection
Marker-assisted selection in breeding programs
Introduction
Marker-assisted selection (MAS) uses the genotype of a marker instead of, or in combination with, the phenotype of a plant in selection during a breeding program. This is especially helpful for traits that are highly influenced by the environment (e.g. yield, protein contents of seeds), or that are expensive or difficult to test, for example drought tolerance, fruit characteristics in crops with a long juvenile phase such as apple or vine, malting quality in barley or the resistance to a quarantine organism. MAS has the additional advantage that it can be performed off-season and off-site and in the very early stages of plant development since only a small amount of DNA (usually from a leaf sample) is needed. However, MAS also has disadvantages and limitations. The efforts needed to find markers and to create linkage maps are large and not justified for each crop or trait, and many traits may be more easily or just as easily selected using conventional visual selection on the trait of interest. Moreover, the selection result by MAS may be less good than in conventional breeding. This has to be kept in mind when studying the contents of this chapter.
Advantages of MAS
- using larger numbers of individuals
- With high-throughput MAS many plants in segregating breeding populations can be scored already at a young plant stage to discard all plants that do not have the desired combination of marker alleles (and hence the desired gene combination). Only the desired plants are kept, and those can be judged for other traits that are relevant to the breeder, but not covered by the markers. This implies that more populations and much larger populations can be handled than in case of conventional breeding, so MAS allows selection between and within more crosses and between more individuals per cross.
- Favorable traits can be selected at seedling stage, for example phenotypic testing of flour color (white or yellow) in wheat requires grains formed by mature plants; associated markers can be observed in 10-day old plants. This is even more important in crops with a long juvenile period (e.g. tulip, apple).
- elimination of unreliable phenotypic evaluation in field trials due to unfavourable conditions for the trial, or maybe large environmental effects on the trait = selection for traits that have a low heritability (or that have a low heritability in a particular trial, location, year)
- For example, disease resistance: the disease might not be present at a certain location or in a certain year
- Some traits, such as yield can be (marker-assisted) selected for on individual plant basis. By visual selection, this is hardly possible in most crops and it might require some extra years of propagation before enough material for a trial (per genotype) would be available for effective selection on such traits.
- more efficient backcrossing, because by using markers, selection against donor "background" and positive selection for "foreground" (the target allele) fewer rounds of backcrossing are required to eliminate the possibly unfavorable donor alleles.
- combining multiple genes simultaneously (gene 'pyramiding'), even if each gene alone would result in the same phenotype (for example: if several resistance genes each result in complete resistance, the phenotype in a bioassay does not tell the breeder how many R genes, and which, are present). MAS could maximize the number of resistance genes or allow the selection of a specific set of resistance genes. For race-specific resistance genes, genes working against different races could be stacked without the need of performing disease resistance tests with all races.
- testing for specific traits where phenotypic evaluation is not feasible (e.g. quarantine restrictions may prevent exotic pathogens to be used for screening; for oil contents of fruits in male (dioecious) oil palms). In animal breeding, think of marker-selection among bulls for breeding values for milk yield of their daughters even before these are born.
Disadvantages and limitations of MAS
- high initial investments (lab facilities, know-how) are needed, or costs for outsourcing the marker development and analyses
- the search for markers is time consuming
- genetic maps are desired also for different exotic parents which act as donors for desirable genes
- markers and the genes to which they are linked may be not polymorphic in segregating populations derived from other parental pairs. A marker-linked QTL for high yield found in cross A x B may not segregate in cross C x D, since it is fixed there already (as either the homozygous – or the + allele, or some unknown allele).
- In material to which multiple parents contributed, the marker allele that indicates a relevant trait gene to select for or against, the marker allele(s) for selection should be diagnostic: they should not occur in the other contributing parents, since there they may not be linked with the same relevant trait allele. The marker allele should be uniquely indicative for either the positive or the negative allele of the gene of interest, not in some crosses associated with the positive allele and in other crosses with the negative allele.
- some markers are inconsistent in their behavior
- failure to amplify or cut or hybridize
- MAS allows selection on the basis of individual genes. However, genes may behave background and environment dependent, i.e. they may have a different effect in a different genetic background because of
- epistasis: the effect of one gene is decreased or overruled by the effect of another gene (increase would also be possible and an example of interaction, but not a disadvantage in that case). The effect of a gene may depend on the presence of some other gene(s) in the genetic background that occurred in the population in which the gene was mapped, but may fail to occur in other parental material. Epistasis may also show at the metabolic level: a gene product might biochemically interact with a product of another gene.
Next to selection purposes, genetic markers can also be used, e.g.:
- to test the purity of a variety
- to test the identity of a variety and its putative ancestry
- to quantify the genetic diversity between species
Summary
→ MAS has advantages but also important disadvantages and limitations
Towards the end of this chapter, use of MAS in specific steps in breeding programs will be treated, such as marker-assisted backcrossing and marker-assisted gene pyramiding. However, before markers can be used for MAS in practical breeding programs, often some work needs to be done first.
From markers to breeding
Not all markers that are discovered in scientific research are suitable for MAS-programs in practice. This could be due to a number of reasons, for example, they might be:
- not linked tightly enough to the genes of interest
- be too technically difficult to operate
- be too expensive to use at a large scale
Therefore, markers have to be tested and often further developed to make sure they reliably predict phenotypes and can be applied in high throughput screening. To develop markers suitable for MAS, usually the following steps are performed:
- high-resolution mapping
- validation of markers
- haplotyping
- marker conversion for high-throughput assessment
High-resolution mapping
Why use high-resolution mapping?
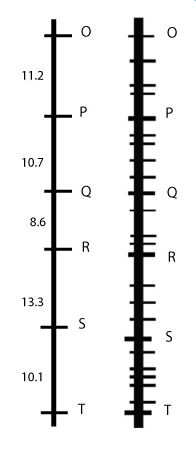
Mapping studies may reveal linkage between genes and markers. However, in most cases, this linkage is not tight enough to be useful in marker-assisted breeding programs. This 'loose' linkage between a marker and a gene results in a too high percentage of recombination events between gene and markers, resulting in unreliable selection. Preferably, the mapping distance between marker and a gene has to be reduced to less than 5 cM, or rather < 1cM. This can be done by using larger mapping populations and a larger numbers of markers. This process is called high-resolution mapping.
The best marker is based on the DNA sequence of the desired allele of the gene itself. Variations in all traits are caused by variations in the DNA, which can sometimes also be made visible in markers.
|
|
Suppose Q is the target gene of interest. Markers R and P are too far away to make them full-proof as indicator of the Q allele. Saturating the region with more markers results in markers that are more closely linked with Q than P and R were.
Note:
The first picture in this module, in Markers, page 1 'What is a genetic marker', shows a gene of interest which is flanked by two markers, which are located right at the begin and the end of the gene. This was an illutration to make things clear. However, the probability of finding markers at those exact positions is very low.
|
Alternatives for high-resolution mapping
If the position of a gene and two flanking markers is already known, one can use these two markers instead of high-resolution mapping. Even when the flanking markers are not very tightly linked to the gene of interest, they can be used for MAS, because double recombination within a circa 6 cM region is very rare. We discussed this in the chapter on QTL analysis in the section on Simple-interval mapping.
High-resolution mapping II
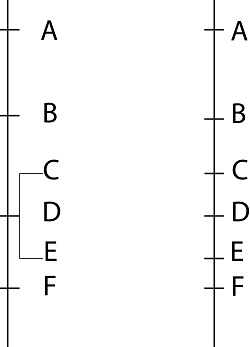
Sometimes, a group of markers always segregates together in a mapping population. In that case, their order on the map is not clear. When a larger mapping population is used, some recombinations among those markers may occur, and their relative positions on the map may become clear. Such a further resolution will not be possible if the DNA stretch is not or insufficiently homologous to the DNA of the other parent (see chapter on Linkage mapping, paragraph on "Other reasons for large gaps in genetical maps: non-polymorphic DNA regions".
|
|
Co-segregating polymorphic markers C, D and E (left), may segregate and be mapped on the chromosome when a larger mapping population is used (right).
|
Relevance of population size for high-resolution mapping
To estimate the location of a gene or QTL on the genomic map very precisely, large mapping populations are needed. The QTL is discovered on the basis of the phenotyping of the mapping population for the trait of interest. That trait is measured under a certain experimental error, and there is only a very limited probability of recombination across the chromosome, so that many linked positions have almost the same association to the trait. In addition, other unlinked or linked QTLs may also influence the trait. This results in generally large support intervals for QTLs. No general minimum number of individuals for a population size can be given to perform high-resolution mapping, but in a larger population, the probability of finding recombinants is higher than in a small population and the distance between marker and gene can be estimated with more accuracy. In order to find a marker within 1 cM of a desirable gene or another marker locus, population sizes of more than 1000 individuals have been used. 1 cM of map distance corresponds to 1% of recombinants, so theoretically 10 recombinants in a population of 1000 individuals. A large population (for example n=1000 RILs) will imply phenotypic comparison of about 500 RILs with the AA alleles of the gene, and 500 RILs with the contrasting aa alleles, which should give a better estimation of the phenotypic contrast caused by the two alleles than in the case of 100 RILs. However, phenotyping 1000 RILs is not always technically or economically feasible. The breeder has to compromise here.
Normally, fine mapping a gene of interest is done on the basis of screening of progeny of a plant that is heterozygous for the QTL region, but rather homozygous for the rest of the genome. A suitable plant is the last backcross before reaching the homozygous NIL-status. The 1000-s of individuals and their progeny are only genotyped for markers in the QTL region.
Show/hide comprehension question...
Techniques
Mapping additional markers may saturate linkage maps in the region where also genes of interest are located. Techniques that produce many markers per reaction, such as DaRT or SNP platforms, are usually preferred to increase marker density (see chapter on markers). In the following pages, several other techniques are described for high-resolution mapping.
Summary
→ High-resolution mapping is often needed to find markers that are more closely linked (< 1 - 5 cM) to the gene of interest than the markers that were initially identified near the mapped gene.
→ Large segregating populations are needed for high-resolution mapping
Show/hide comprehension question...
Show/hide comprehension question...
High-resolution mapping of specific chromosomal regions
There are two possibilities to obtain a higher resolution (a higher density of markers) of a particular chromosome region of interest:
- Through bulked segregant analysis (BSA)
- Through development of near-isogenic lines (NILs)
Bulked-segregant analysis
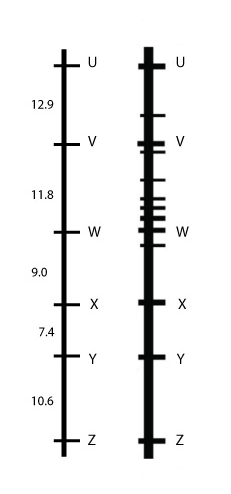 A bulked-segregant analysis (BSA) approach can be applied to target specific chromosomal regions (between target marker loci V and W). We have seen BSA in the previous chapter, where it was used to identify markers linked to genes, by means of grouping individuals of the phenotype classes corresponding to the genotypes for the gene of interest. In this case, however, phenotypic groups are not needed, since we are trying to find markers linked to other markers, not to a gene for a phenotypic trait:
If a gene for a trait of interest was calculated to be located between marker loci V and W in a mapping study, in the BSA approach DNA is pooled from VW plants and from vw plants. The DNA from these two pools, is tested for many markers. A marker that has one specific allele in the VW pool and another allele in the vw pool, thus co-segregates, must be located very closely to marker loci V and W.
To find out whether these newly found markers are located more closely to the gene of interest than V and W, individual members of the mapping population will be genotyped with those new markers, and the position of those markers (likely near V and W) will be determined. Next, the association of those markers with the trait value will be determined to see which will appear to be the peak marker.
Near-isogenic lines
Also near-isogenic lines (NILs) can be used to construct high-resolution maps for specific chromosomal regions (see figure below), because NILs differ from each other only with respect to small portions of the genome. Once a QTL has been identified and its approximate position is known from mapping studies, NILs can be created that contain only a single QTL by repeated backcrossing with the recurrent parent. During this process, there may or may not be active selection against donor parent marker alleles in the background (marker-assisted backcrossing – speeds up the selection process). High-resolution mapping can sometimes also reveal the presence two closely-linked genes, which are seen as one QTL in a small mapping population. One of the difficulties in precisely locating a QTL on a linkage map for a quantitative trait is that other QTLs influence the trait as well and therefore the error in the estimated map position of a given QTL can be quite large. By creating NILs that (preferably) each only have a single segregating QTL this effect is reduced and therefore the map position can be established more accurately.
In this example, a near-isogenic line (NIL) contains a gene of interest which is situated between markers M1 and M2.
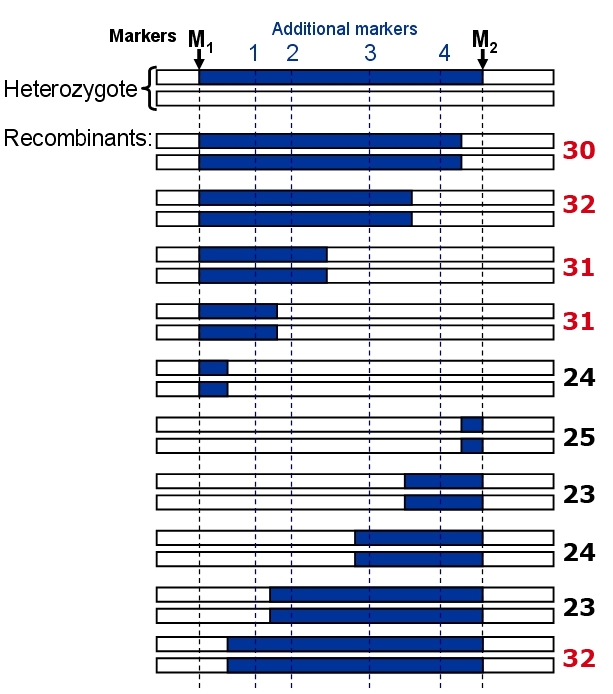
Example of fine mapping of a QTL, starting from a heterozygous Near-isogenic line containing only one segregating QTL. The blue chromosome segments represent the DNA of the + allele donor of the trait. Logical analysis shows that the contributing gene should be to the left of additional marker 2, since the fourth recombinant has still the high trait value. The low trait value of the ninth recombinant (23) also suggests that the gene should be to the left of marker 2. In this example, the gene could also be left of marker 1, so we conclude that the gene is located between M1 and marker 2. Note that we should test preferably more than one recombinant per marker interval and phenotype several replicates for every recombinant genotype if possible, to reduce environmental effects on the mean trait value of each recombinant.
Suppose that the gene of interest is located in between marker 1 and marker 2, recombinants between marker 1 and 2 may either have the higher or the lower trait value, depending on the precise location of the gene and the precise location of the recombination event. If the marker 1 – marker 2 interval is largely blue, and the gene is half-way, the trait value will be high, if it is largely white, the trait value will be low. Finding both trait value classes in the same recombinant group is evidence that the gene is in that particular marker interval.
Next, the NIL and recurrent parent are crossed to develop an F2 between them (it may also be the last backcross towards a near-isogenic line). In the F2 recombinants between M1 and M2 may be identified. Running the additional markers between them (1, 2, 3, and 4) will tell where the recombination occurred approximately. The recombinants contain different parts of the original donor fragment and can all be recognized by recombination between M1 and M2. In the figure, 10 different progeny lines are shown and 4 additional markers between M1 and M2 are needed to distinguish them. Phenotyping of the plant will show in which interval (M1 - 1, 1 - 2, etc.) the donor allele of the gene of interest is located. When a QTL is situated between M1 and M2 it can be mapped more accurately (assigned to a smaller region) using markers 1 – 4.
Note that the length and end points of each fragment cannot be known exactly from the additional markers. In figures, the fragment ends are always drawn in the middle between two markers but it may in fact be anywhere in the interval.
The homozygous NIL and the recurrent parent are identical, except for the region a little beyond the interval between M1 and M2.
Show/hide comprehension question...
DNA of the NIL and the recurrent parent can be submitted to a search for polymorphism, for example by SNP array. All polymorphism identified should in principle correspond to marker polymorphism in the region of interest. By this way, the area between M1 and M2 may be filled with more markers.
Show/hide comprehension question...
Show/hide comprehension question...
Show/hide comprehension question...
Summary
→ High-resolution mapping of specific chromosomal segments can be performed by using BSA or NILs. BSA is aimed at filling an already identified marker interval with more markers, whereas NILs are used for the actual fine-mapping, improving the estimate of the position of the gene, improving the resolution.
Show/hide comprehension question...
I want to try extra questions | Move on to: Marker validation
Extra questions
Show/hide extra comprehension question 1
Show/hide extra comprehension question 2
Show/hide extra comprehension question 3
Show/hide extra comprehension question 4
Marker validation
Markers that are found to be linked to a gene only appear if the marker is polymorphic (in fact di-morphic) between both parents. However, even if they are closely linked to the gene of interest they have to be tested ('validated') in other populations, such as breeding material, in order to be useful in marker-assisted breeding. Many markers found to be associated with a gene of interest in a mapping population are not useful in breeding material. This can be due to several reasons, e.g.:
- The marker (and maybe the linked gene!) is not polymorphic in other breeding material:
- the contrasting undesirable allele and its associated marker allele that were detected in the mapping work may not occur in breeding lines. Mapping studies may be done on a mapping population derived from an exotic or low-domesticated parental accession that has many undesirable traits: crosses with an economically elite cultivar results in populations in which many markers and QTL alleles are found for many agronomically relevant characteristics. However, most of the markers and negative genes do not occur in offspring from crosses among elite cultivars.
- the marker might have been polymorphic in the mapping population, but the marker allele linked with the desirable allele of the gene of interest may occur in high allele frequency in the breeding population. So, in many crossing populations both parents carry the same (common) marker allele, making it uncertain whether or not the parents carry different alleles for the gene of interest. This is especially a problem in the case of AFLP (or other) markers where a null allele (absence of amplification product) does not necessarily imply a same DNA sequence.
- In different sources, traits may be under the influence of different genes, e.g. a high protein content may be the result of a QTL located on chromosome 1 (gene A) in one source and on chromosome 2 (gene B) in another source. Marker-assisted selection with markers linked to gene A in a population that segregates for gene B is not effective! If gene A is discovered in a mapping population, one may not necessarily presume that the variation in other breeding material is due to the same gene.
- A marker allele that in a mapping study has been indicated to be associated with a gene of interest, may in another breeding line be linked to less desirable allele of the trait gene, due to recombination between the marker in the trait gene in the past. This chance is higher if the other breeding line is more distantly related to the line used in the mapping study.
- Marker alleles for selection in complex crosses should be diagnostic. If material has been generated from crosses in which the parent with the desirable gene was only a great-parent (or more remote relative) the offspring can only be selected for the gene of interest if the associated marker allele is diagnostic (unique). This means that the marker allele to be selected for should not also occur in one of the other ancestors. If one or more of the other ancestors has the same marker allele, it may not have the same gene of interest, so selection for the marker allele makes it uncertain which trait gene is being selected. This is in particular a limiting factor in the case:
- the marker allele to be selected for is a null allele. In for example AFLP a null allele may be due to different causes (see above).
- the marker is an SSR marker. SSR markers are based on differences in numbers of repeats, which might not pair correctly during meiosis. As a result, offspring may have a different number of repeats, and thus a different SSR allele than expected. This also may happen during separate events in different individuals, resulting in alleles that look the same, but do not indicate a common origin of that allele.
Reliability of a marker can be predicted from its distance to a QTL. To see to what extent a marker is capable in predicting the desired phenotype, the marker should be tested in other populations. This can be done by crossing one of the parents used in the initial mapping population with a different cultivar, to develop another mapping population. In the resulting population, the ability of a marker to predict the phenotype can be evaluated and compared to the original mapping result. However, this is quite an investment, and implies that marker-assisted selection is not just a quick and easy strategy!
The best possible markers are markers that are part of the actual functional gene sequence or so tightly linked that they show no recombination with the target gene. Also markers that are consistently found to be absolutely linked to the target gene and unique in the germplasm. Such markers are highly predictive for the target gene and have a good change to be 'diagnostic' as well.
Summary
→ Markers need to be validated to make sure they are indeed tightly linked to genes of interest in breeding material
→ Markers need to be diagnostic to be followed if the donor of the gene is crossed to elite breeding lines of various origin
Show/hide comprehension question...
Show/hide comprehension question...
Show/hide comprehension question...
I want an alternative explanation | Move on to: Haplotype
Alternative explanation on marker validation
Marker validation is the determination whether or not markers can predict a certain trait in the wider breeding material.
Markers are developed in mapping populations. However, a marker that is tightly linked to a gene of interest is not necessarily perfect in predicting a trait in breeding material. For example, when the genes affecting a trait are located on different parts of the genome and a specific marker is only tracking one of the genes on one chromosome, while in other material a different gene is segregating for the same trait, on a different chromosome is responsible. In other breeding lines, the genes for that trait will be associated with different markers than the one that was discovered in the mapping population.
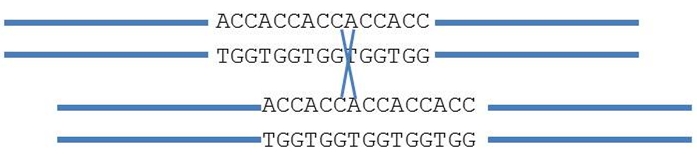
Also, marker alleles might look the same, but are in fact different. The following SSR (simple sequence repeat) marker, consists of five ACC repeats. The number of repeats determines the size of the amplification fragment. During normal pairing, fragment length does not change. However, sometimes pairing is unequal and shifted (see figure). Recombination (cross) causes the number of repeats to change to four or six ACC motifs: new alleles are formed. This may happen on several occasions resulting in alleles that appear identical (e.g. with 6 repeats) but are formed during different events.
Therefore, even markers that are very tightly linked in a mapping population have to be validated in the relevant breeding material.
Haplotype
A haplotype is a specific combination of alleles that occur in linkage. In the case of markers, if such a string of closely linked markers surround a gene of interest, the chance is considerable that the haplotype is "diagnostic" (unique), allowing the breeder to follow the presence of the gene of interest in descendants of the donor that contributes the gene.
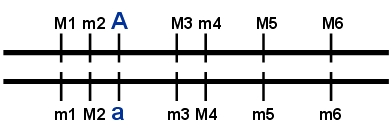 In this example, the haplotype M1m2M3m4M5M6 is typical for the desirable allele A of the gene; haplotype m1M2m3M4m5m6 is typical for the undesirable allele of the gene. Note that descendants that carry the A allele but have a recombination between for example M3 and m4 will probably form a novel and aberrant haplotype, and cannot be recognized for sure to carry allele A. If the constituent markers are tightly linked, the chance for such a recombination is very small.
The advantage is that, across a range of possible accessions, the multi-marker haplotype has a much larger chance to be diagnostic for the favorable allele than a single marker or a pair of markers flanking the gene of interest. The haplotype may be used to screen the elite lines or cultivars of a breeding program for having the desired allele A and subsequently use these as parents in crosses. If we use a parent carrying allele A and the marker haplotype as donor in a complex crossing programme involving various other parents, we may monitor the presence of allele A by scoring all six markers. It is extremely unlikely that another accession of the crop would be by chance M1m2AM3m4M5M6, without carrying allele A. If another genotype for example has M1m2M3M4m5m6, then this is a third haplotype. For this third haplotype it is not known whether it carries the A or a allele; only the known haplotype provides sufficient certainty.
A prerequisite for selection on the basis of haplotypes is that you need to be able to run large numbers of markers (e.g. on SNP platforms).
Summary
→ Haplotyping addresses several specific marker alleles to a desirable allele of a gene and diagnostic for the gene that they are used for
.
Show/hide comprehension question...
Marker conversion
- For information about different markers, please refer to the chapter on Markers -
There are situations where markers need to be converted into other types of markers:
- Some older types of markers are not high-throughput, and cannot be efficiently applied in breeding.
- When a diagnostic marker in one mapping population is not polymorphic in other material.
How does it work?
The exact procedure to convert markers goes beyond the scope of this course, but an example is given below that will mention several necessary steps. The method is also used for convert gene sequences into convenient markers.
To convert RAPD or AFLP marker or a gene sequence into a SNP marker for use in MAS we need to:
- Amplify the gene sequence of the two parents, or:
- Clone the RAPD or AFLP band as follows:
- cut out the band from the gel
- extract DNA from that part of the gel
- clone the DNA into a vector and transform into Escherichia coli
- Sequence the DNA of the amplified fragment
- Compare the sequences to find one or more SNPs between the parents, flanked by a large number (about 50) non-polymorphic base pairs.
- The SNP and the flanking sequences are used to run SNP markers on progeny from the cross.
Summary
→ For use in practice, markers need to be converted into markers that are highly reproducible, easy to use, quick and cheap.
I want an alternative explanation | Move on to: Selection of QTLs
Alternative explanation on marker conversion
Marker conversion is changing markers that are unreliable, technically difficult to operate, or not polymorphic between a new pair of parents. They are converted into reliable markers that are simple to operate and relatively cheap.
To create a linkage map, the first aim is to get as many closely linked markers as possible. In this process, also markers are used that are expensive and complicated to use. For marker-assisted breeding, two flanking markers per gene may be sufficient and because of the scale of use, it is important that the operation of this marker is simple, reliable and cheap. Therefore, markers that are poorly reproducible (like RAPDs), relatively expensive and/or relatively difficult to operate (like for instance AFLP markers or CAPS markers that require an additional digestion step) have to be converted to markers that can be run at high throughput, such as SNPs.
Selection of QTLs
QTL selection
Quantitative traits are often controlled by several to many genes. Theoretically, all markers in QTL regions could be used for MAS. However, some QTLs might only explain a very small portion of the total variation. It might not be economically feasible to include such QTLs in the breeding program. Breeders should focus on the QTLs that account for the largest proportion of phenotypic variance for the trait.
QTL validation
All QTLs selected for by MAS should be phenotypically expressed across environments and effective in different genetic backgrounds and in relevant growth stages of the crop. Therefore, we have to check whether the QTL found in the mapping population is also effective in other genetic backgrounds. To do this, first a NIL is developed containing only a single QTL. Then, this QTL-NIL is compared with the recurrent parent to see whether the QTL has the expected effect in the new genetic background. This is known as QTL validation.
Summary
→ In marker-assisted breeding, focus should be on QTLs with a major effect (and only after QTL validation).
Show/hide comprehension question...
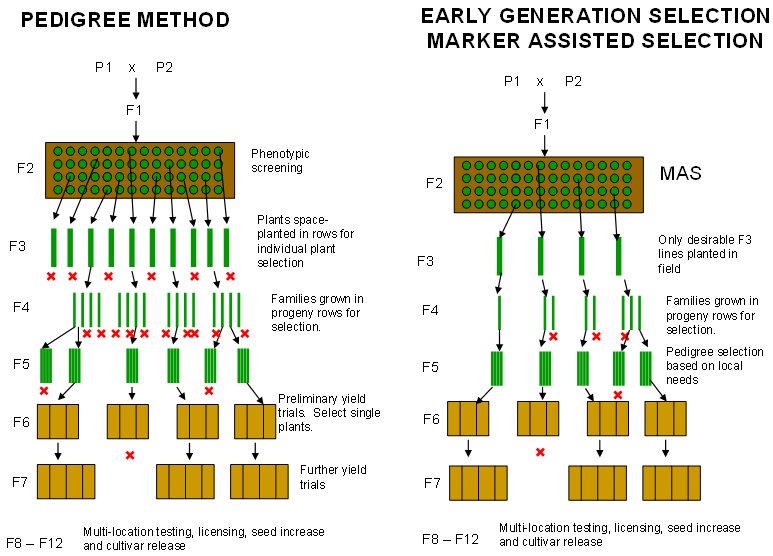
Early generation selection
By discarding most genotypes that lack certain desirable traits at an early stage, the number of plants tested in the next generation in the field is reduced (or kept the same, but with a higher proportion of promising genotypes). This can be achieved using MAS.
Early generation selection scheme using MAS (right) as compared to the conventional pedigree method (left). With MAS, only desirable F3 lines are planted in the field. Since fewer F3 lines are planted, more individual plants may be planted per F3 line. This further increases the probability of selecting superior individuals and allows more crosses to be evaluated at the same time. (Source: B. Collard & D. Mackill (2006).)
Summary
→ In early generation selection, MAS may help to discard many plants that lack important traits that are difficult to test phenotypically.
I want extra explanation | Move on to: Marker-assisted backcrossing
Extra: saving time and money
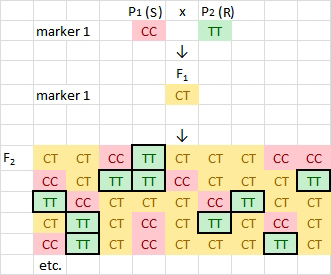
MAS scheme for early generation selection in a typical breeding program for disease resistance. A susceptible (S) parent is crossed with a resistant (R) parent and the F1 plant is self-pollinated to produce an F2 population.
In this example, a robust SNP marker (allele T) has been developed for a major effect QTL contributing to disease resistance. By using a marker to assist selection, plant breeders may significantly reduce the size of field trials by eliminating many unwanted genotypes (marker genotypes CC and CT) and retain only those plants possessing the desirable homozygous genotypes for this locus (highlighted cells in the F2).
Note that 75% of the plants may be discarded after one cycle of MAS. This is important because plant breeders typically use large populations (e.g. 200 to 800 F2 plants per crossing combination) and hundreds of crossing combination in a single year.
Marker-assisted backcrossing (MAB)
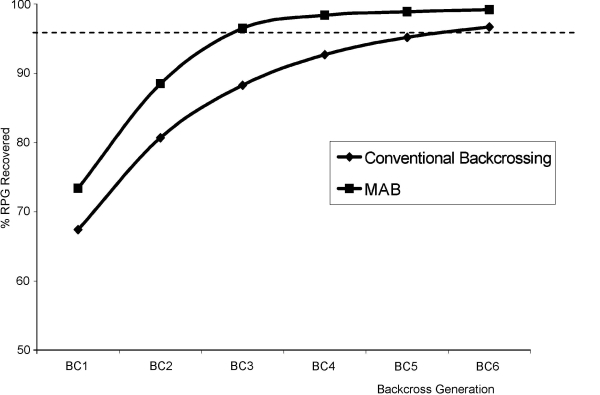
Backcrossing implies repeated crossing with a (recurrent) parent. The recurrent parent is often a modern line or variety, with a desirable overall genotype, but lacking one or several important genes. Using conventional breeding methods, it typically takes 6–8 backcrosses to achieve a sufficiently high proportion of the recurrent parent genome. This requires a long time, during which the variety used as recurrent parent might have become outdated. The objective is to eliminate the undesirable genes in the genetic background in the first place, rather than to obtain a near-isogenic copy of a certain modern cultivar. Therefore, often not the same variety is used as recurrent parent but different modern varieties may be used successively, from BC3 or BC4 onwards.
Theoretical expected portion of recurrent parent genome after backcrossing, follows the formula (2n+1−1)/2n+1 (where n = number of backcrosses). In reality, the percentages may deviate due to random sampling variation.
|
Generation
|
Recurrent parent genome (%)
|
|
F1
BC1
BC2
BC3
BC4
BC5
BC6
|
50
75
87.8
93.75
96.88
98.44
99.22
|
Note that the expected percentage for the entire BC1 population of the recurrent parent genome is 75%, but by chance, some individuals possess more of the recurrent parent genome than 75% and others less than 75%.
Marker-assisted backcrossing may accelerate the backcrossing process by selecting against as many as the marker alleles of the donor in the background (i.e. away from the locus of the desired gene to be incorporated). In each BC generation, some plants have by chance more and others less than the statistically expected proportion of donor background. Running of the genome-wide markers. will identify individuals that happen to have a relatively low proportion of donor genotype in the background. Selection against the donor background may be done with or without a linkage map being available. See more about this subject under Principles of Plant Breeding, section Selection Methods.
- when a genetic map is available: using evenly spaced markers
- when a genetic map is not available (which is sometimes the case for exotic material): selection against all marker alleles from the donor parent, regardless of their (unknown) position in the genome.
Foreground selection (i.e. selection for the target gene to be incorporated) requires two flanking markers, to prevent selection of the donor marker, but losing the linked gene because of inadvertent recombination.
|
|
|
Graph of computer simulations of the percentage of recurrent parent genome (RPG recovery) in the total genome, using marker-assisted backcrossing (MAB) and conventional backcrossing. The use of markers can reduce the number of generations required to achieve the desired proportion of the recurrent parent genome (here 95%, indicated by the dotted line). (Source: Collard et al., 2005).
|
(Dis)advantages of MAB
Considerable time savings can be made with MAB compared to conventional backcrossing, which could lead to economic benefits, resulting from the accelerated release of an improved variety. On the other hand, the initial cost involved in marker-assisted backcrossing would be higher than with conventional backcrossing and large investments are sometimes needed:
- Many markers are required, well spread across the genome, and preferably a genetic map, which usually is not available for exotic donors
- Markers that are associated with a gene of interest need to be converted to diagnostic markers or haplotypes that can be run in high throughput assays
- It is not sure whether a gene discovered to be beneficial in one genetic background will also have such a beneficial effect after transfer into a different genetic background. Many genes probably perform through interactions with other genes. Genes taken out of that context may lead to disappointing results.
Summary
→ MAB can be used to minimize linkage drag (see Principles of Plant Breeding, Backcross Breeding) and to maximize recovery of the recurrent parent
Show/hide comprehension question...
Show/hide comprehension question...
I want an alternative explanation | Move on to: Marker-assisted gene pyramiding
Alternative explanation on marker-assisted backcrossing
Study the following example >> (this is an external link).
Marker-assisted gene pyramiding
Gene pyramiding or gene stacking is the process of combining multiple genes for one trait into a single genotype. The most widespread application for pyramiding has been for combining multiple disease resistance genes to a same pathogen species in order to develop durable disease resistance. When several resistance genes are combined, the probability that this resistance is broken is small, since the pathogen should undergo simultaneous mutations or recombinations for the corresponding genes for avirulence. Because each resistance gene on its own provides complete resistance, it is difficult to test phenotypically whether plants have either one (e.g. R1R1r2r2) or more (e.g. R1R1R2R2) effective resistance genes. In that case, MAS may be of help.
Without MAS, for example, to discriminate the desirable genotype R1R1R2R2 (resistant) from genotypes R1R1r2r2 and r1r1R2R2 (also resistant), one needs to do several testcrosses:
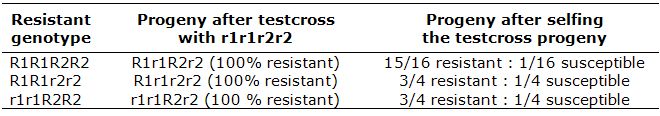
With MAS, using reliable markers, plants can be selected directly in the F2:
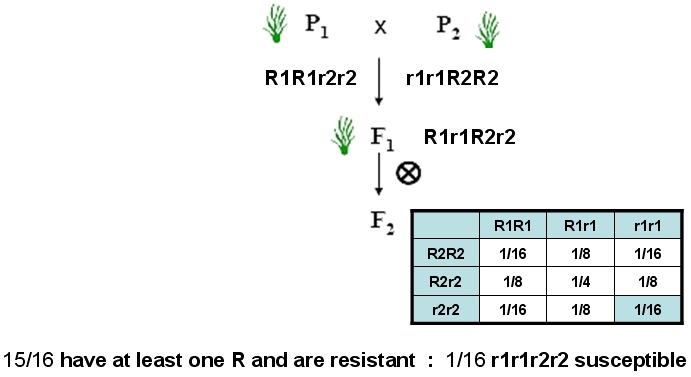
Marker-assisted pyramiding of two dominant disease resistance genes for the same pathogen.
Each resistance gene provides 100% resistance against the pathogen. Combining two different resistance genes in a variety is thought to make this resistance more durable, because the probability of simultaneously overcoming both types of resistances presumably is small. During conventional phenotypic evaluation, no difference can be observed between Rr and RR plants. Simultaneous testing of resistance genes R1 and R2 can be done using phenotypic evaluation, for example removing several leaves from the plant and inoculating the leaves individually with different isolates (one for R1 and one for R2) of the pathogen ('detached leaf assay'). However, it will remain uncertain whether plants are R1r1 or R1R1 (Adapted from B. Collard & D. Mackill (2006).)
Summary
→ MAS may be useful in gene pyramiding when each of the individual genes result in the same phenotype
Show/hide comprehension question...
Show/hide comprehension question...
Simultaneous selection for multiple traits
MAS can also be used to bring together multiple traits in one genotype, e.g. genes for high quality, genes for high yield, resistance genes etc. If all genes are tagged by markers, we can calculate which (very small) fraction of a pedigree derived from a complex cross (with many different grandparents) combines all desirable genes.
Cost/benefit analysis of MAS
The cost of using 'tools' in breeding programs is a major consideration. Factors that influence the cost-benefit ratio of MAS versus conventional phenotypic selection include the following aspects.
A + indicates that MAS could be efficient
a - indicates that phenotypic selection would be more efficient
a ~ indicates that the objective and population type determines whether MAS or phenotypic selection is more efficient
- inheritance of the trait
- dominant (~), recessive (~)
- traits regulated by one or few genes with a large effect (-) or several genes each with a small effect (+)
- method and reliability of phenotypic evaluation
- easy (-)
- cheap and reliable (-)
- marker systems reliable, high-throughput and inexpensive (+)
- field/glasshouse and labor costs high (+), cost of resources high, compared with the costs and investments of running marker systems (+)
- the crop
- high ploidy level (-)
- economic value high (+)
- etc.
In many cases, phenotypic screening is cheaper compared to MAS. Moreover, phenotypic screening remains necessary to determine which marker is associated with the trait of interest. Where phenotypic screening requires time-consuming and expensive assays, MAS, with all its pros and cons might be an attractive option. An important consideration for MAS is the large initial cost of marker development. A mapping population should be created, phenotypes, genotyped with many markers to find relation between a marker and the trait gene. This is a substantial investment, especially for traits with a low heritability. Costs for running a known marker range from several cents to € 5 and up per sample, and also depend on many factors, such as technique used and efficiency of use of lab facilities.
Benefits of MAS generally include the ability of testing more individuals and more efficient selection, resulting in a quicker release of cultivars.
Summary
→ Initial costs of MAS are high, compared to conventional selection
→ MAS can save time and money, depending on many factors
- END OF THIS MODULE -