Steps to perform - an example
Linkage is deduced from the observation that loci are associated in offspring and not segregating independently. As we know, the process involves the following steps:
- Crossing two parents and creating a mapping population
- Genotyping: identification of polymorphism, and running of markers on the individuals of the mapping population
- Linkage analysis: determining recombination frequencies between markers and consturncion of a linkage map using these recombination frequencies
- Phenoytping: determining trait values for phenotypic traits in the individuals of the mapping population
- QTL analysis: statistically combining the marker information with the phenotyping information to determine associations between markers and trait values.
An example
Assume an autogamous species, using SNP markers:
- Crossing two parents and creating a RIL population of 500 individuals (just 13 are shown here)
- Genotyping: SNP analysis
- Linkage analysis
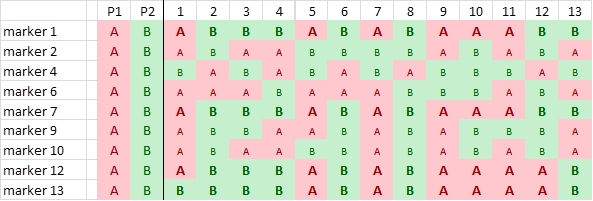
In this example we have scored the parents and progeny for 12 SNPs. Four of them are not polymorphic (3, 5, 8 and 11):
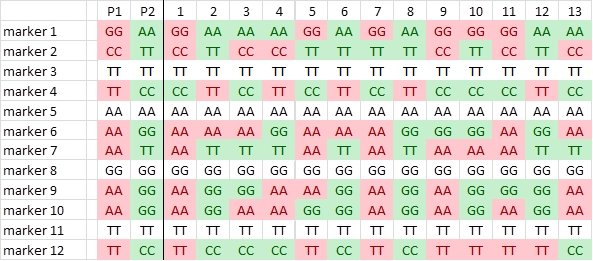
We identify the parental origin of each SNP allele, and color accordingly red (origin P1) or green (P2). Next we convert the P1-alleles to A, and the P2-alleles to B, and delete the non-polymorphic SNPs:
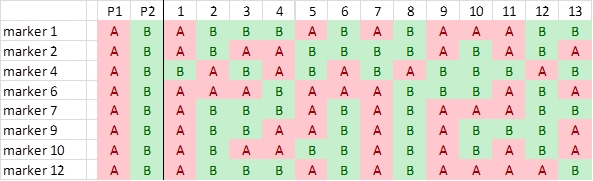
Comparison of segregation patterns show that highlighted markers 1, 7 and 12 show an associated segregation pattern. There is only one recombination:
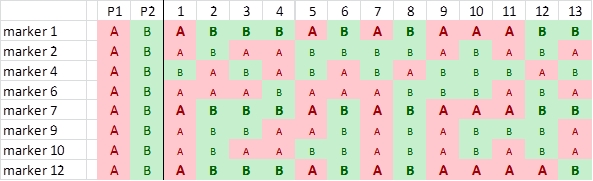
This indicates that markers 1 and 7 are more closely linked with each other than with marker 12.
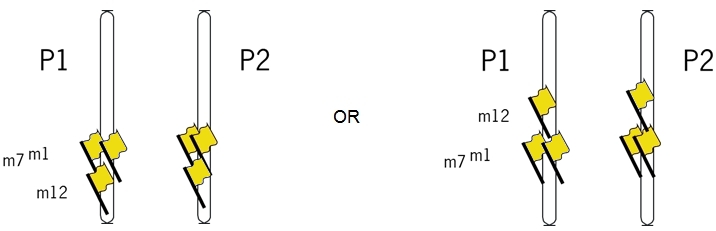
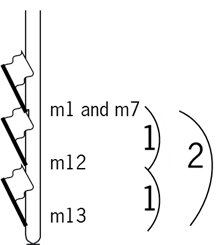
The chromosomes below illustrate the position of markers 1 and 7 relative to marker 12. Note that we do not know the orientation of the markers yet.
Suppose, we find an additional marker (13) that has segregation pattern which is similar as that of markers 1, 7, and 12, but there is one additional recombination event in this set of 13 progeny plants: plant 1, relative to markers 1, 7 and 12:
The numbers of recombination events represented by this set of progeny is presented in the table below:
|
|
marker 7 |
marker 12 |
marker 13 |
|---|---|---|---|
|
marker 1 |
0 |
1 |
2 |
|
marker 12 |
1 |
- |
1 |
|
marker 13 |
2 |
1 |
- |
So, logically, markers 1 and 7 are closer to marker 12 than to marker 13:
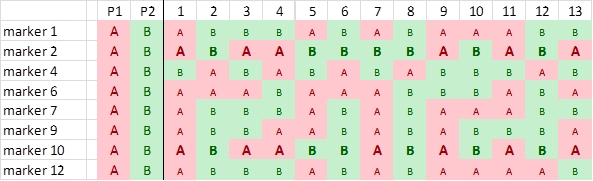
Now we find another pair of markers that has an associated segregation pattern: markers 2 and 10. Their pattern is not associated to the pattern of markers 1, 7, 12 and 13, so they form a different "linkage group". Linkage between markers 2 and 10 is not absolute, since there is recombination (plant 7):
Etcetera. Finding associations between numerous markers in a large number of individuals is an automated process.