Step 3. Linkage analysis of markers
|
|
|
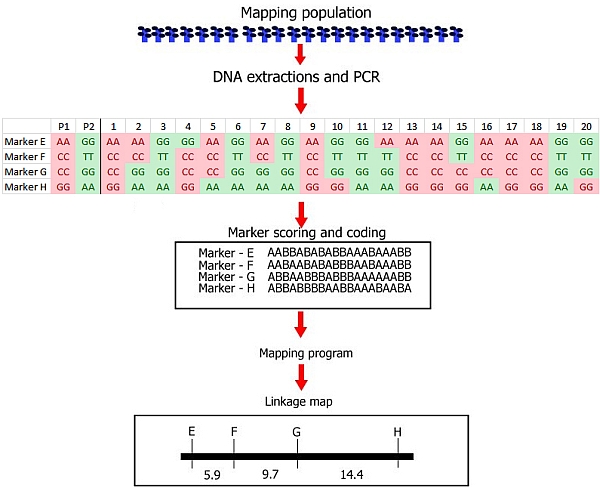
Steps involved in the construction of a linkage map with DNA markers. |
As we have seen before, the three main steps of linkage map construction are:
(1) Development of a mapping population
(2) Genotyping: identification of polymorphism of markers in parents and progeny and running the markers
(3) Linkage analysis of markers
After the linkage map has been constructed, these steps are followed by:
(4) Phenotyping: to go from the linkage map to QTL analysis
(5) QTL analysis
After having recorded the genotype of each individual of the mapping population for each segregating marker as A or B, we can perform a linkage analysis: i.e. we determine whether some markers tend to segregate in association with each other (or not at all). Computer software has been developed to perform such an analysis.
We now roughly illustrate the simplified process of linkage analysis, for four hypothetical markers, located on the same chromosome. For simplicity, we show only the data for the first 20 individuals out of a population of 200 individuals.
It is obvious that the markers show an associated segregation. An individual with the genotype of parent A for marker E has a high probability to carry also the alleles of parent A for the other markers. This association indicates linkage. For the markers E-H in the picture above, we can manually observe per marker pair the number of individuals that carry for one marker the allele of one parent and for the other the allele of the other parent (due to recombination, non-parental genotypes):
E and F: 2 individuals differ
E and G: 5
E and H: 9
So E and H will probably be further apart on the chromosome than E and F (more differences, more recombinants between these markers. However, from this information alone we do not know what the order of the markers and their distances on the chromosome will be. All these orders are possible (differences indicated with dots):
E..F...G....H
F..E.....G....H
G...F..E.........H
More information is obtained if we include the data of other markers:
F and G: 3 individuals differ
This results in possible orders:
E.F...G...H
G...F.E........H
G and H: 4 individuals differ and F and H: 7 individuals differ
These data together result in the most probable order:
E..F...G....H

Linkage map, as determined in our example.
Summary
→ Linkage of marker alleles can be analyzed by assessment of the amount of recombination.
I want extra questions on linkage analysis | Move on to: Linkage analysis in practice
