Example of linkage between a marker and a resistance gene
In this case study, a RIL population of 103 lines is created using the homozygous barley lines L94 and Vada as parents. The parents and the mapping population were phenotyped for their response to a certain disease resistance (R) or susceptibility (S) and genotyped for SNP markers. The picture shows data of the parents and, for simplicity, just 24 of the RILs and only few of the hundreds of segregating SNP markers. The bottom row presents the phenotyping data: resistant (R) or susceptible (S). The picture indicates a clear linkage of the resistance to marker M3. Two recombinations between M3 and the resistance phenotype occur (progeny lines 14 and 21). This implies that the marker is some distance away from the resistance gene. Maybe an additional marker will show a perfect association, and should then be closer to the R-gene locus (assumping perfect classification of the resistance in R and S). As expected the M3 marker allele of Vada (green) is associated with the Vada allele of the resistance gene. If we know the position of M3 on the linkage map, we also know the approximate position of the R gene. If the resistance is due to one gene, and the allele (R versus S) can be scored reliably, we may determine the position of the R locus as precisely as the position of each marker. We just add the R and S data in terms of A, B (in other populations also C and D), as done with markers, and the software can calculate its position on the linkage map.
This procedure is only possible for qualitative traits that can be classified into (in this case two) discrete classes according to their resistance genotypes (phenotype = genotype) and that are monogenic. If the resistance was classified into three or five categories, or if the resistance would be based on more than a single locus, no marker would have a perfect association with the resistance and the resistance could not be mapped as if it was a marker. Mapping procedures assume that each of the scored markers has a single position in the genome).
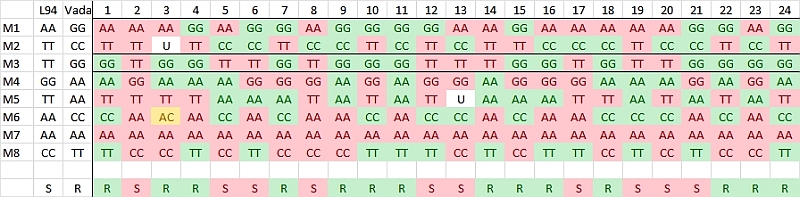
Observed linkage between resistance and SNP markers. Marker M3 is most probably located close to the resistance gene.
Extra discussion on this table:
- Note that progeny line 2 seems identical to parent 1, L94. If this is also true for all additional markers, a mistake at seed harvest may have taken place, or seed bags got confused. At this limited number of markers it may be coincidence.
- Note that this is a RIL population, so occasionally we find a marker that is in one or more RILs still heterozygous or segregating (M6 in line 3). In a DH population such heterozygous markers are not expected.